
Intro to Cutter
18 January 2023
By Jacob Pimental
The majority of my earlier posts focus on reversing binaries using Radare2/Rizin from the command line. While this is a great option, I have recently switched to using the GUI alternative: Cutter. This post will be an introduction to the tool and how to use it.
What is Cutter
Cutter is a GUI interface for the Rizin disassembler. Cutter was originally used by Radare2 so when Radare2 forked off into Rizin, Cutter went too.
Cutter combines a lot of the complex features of Rizin commands into an easy-to-use interface, while still allowing command line access for more experienced users. This is ideal for beginners, but advanced Rizin/Radare2 users can still thrive with this tool.
Cutter UI
The UI is broken out into separate “panels” that the user can drag and drop around the main app to configure the UI how they’d like. For example, a user can have the disassembly view of the current function on the left side of the screen, and the decompiler view of the same function on the right. This is a very simple use case, but it shows that the UI can be as complex or as simple as the user wants.
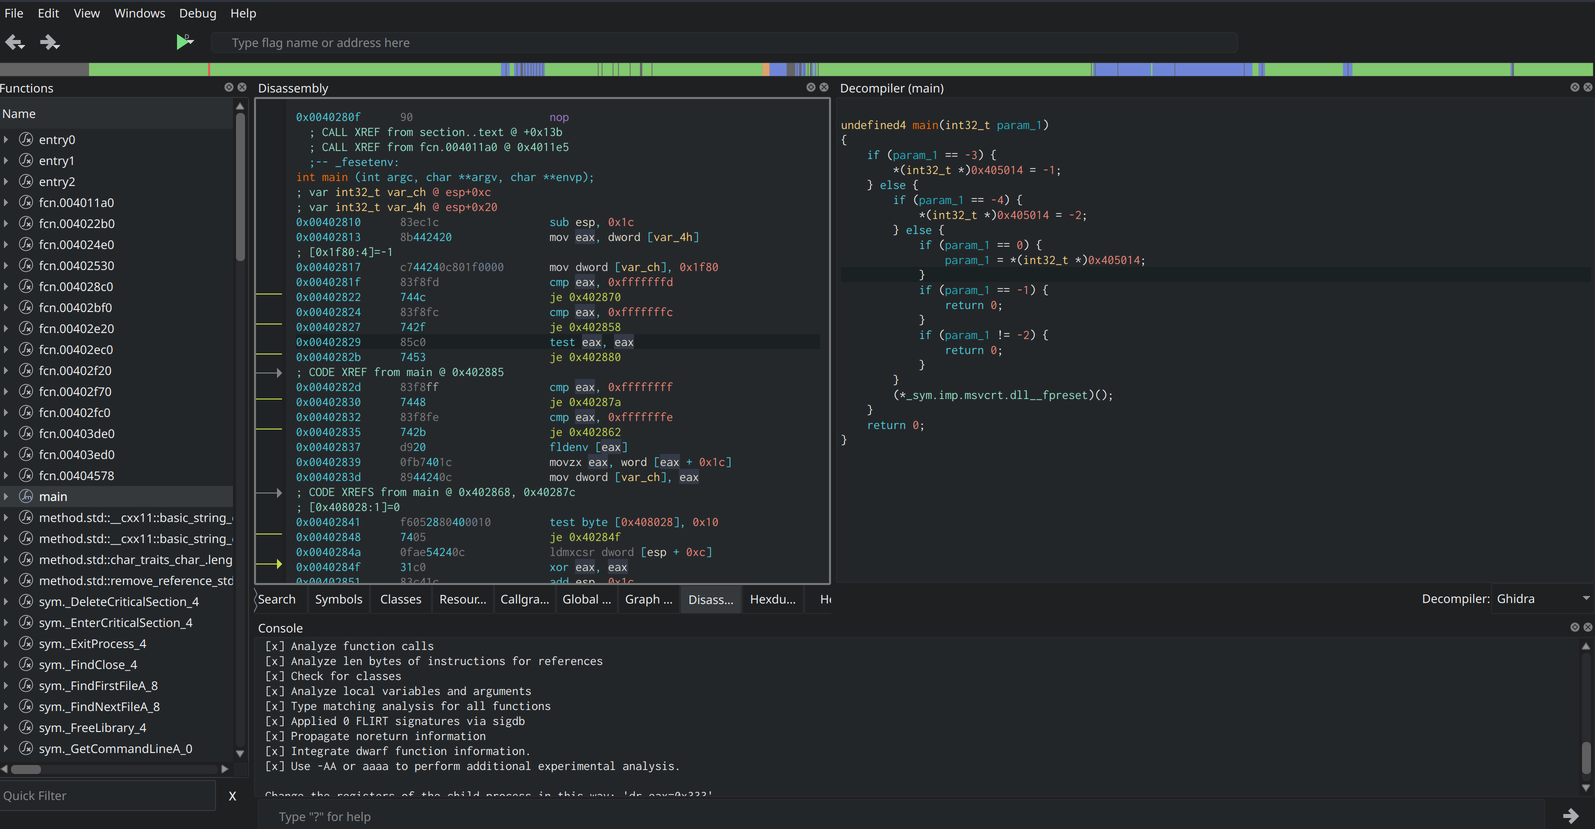 Example of what you can do in Cutter’s UI
Adding New Tabs
Along with the decompiler and disassembler views, Cutter allows you to add other tools to the display to aid in analysis. These tools include strings, a graph overview, custom type information, the Rizin console, a search functionality, and many others.
To add a new window to the current layout go to the Windows menu option and select the display you would like to place. You can then drag the window around the app and place it anywhere in the UI. For example, a user can add a new disassembly tab to the current window by going to Windows and clicking Add Disassembly.
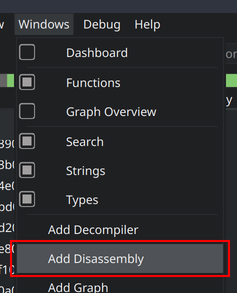 Menu option to add new disassembly window
This will add a new tab to the bottom of the current window.
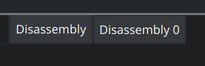 New tab created for the disassembly window
Once the new tab is created, you can move it into a window of its own by clicking the diamond icon in the top-right corner of the window. You can now drag the new window to the right of the screen so that you can split it with another window. This allows you to have two windows opened at once.
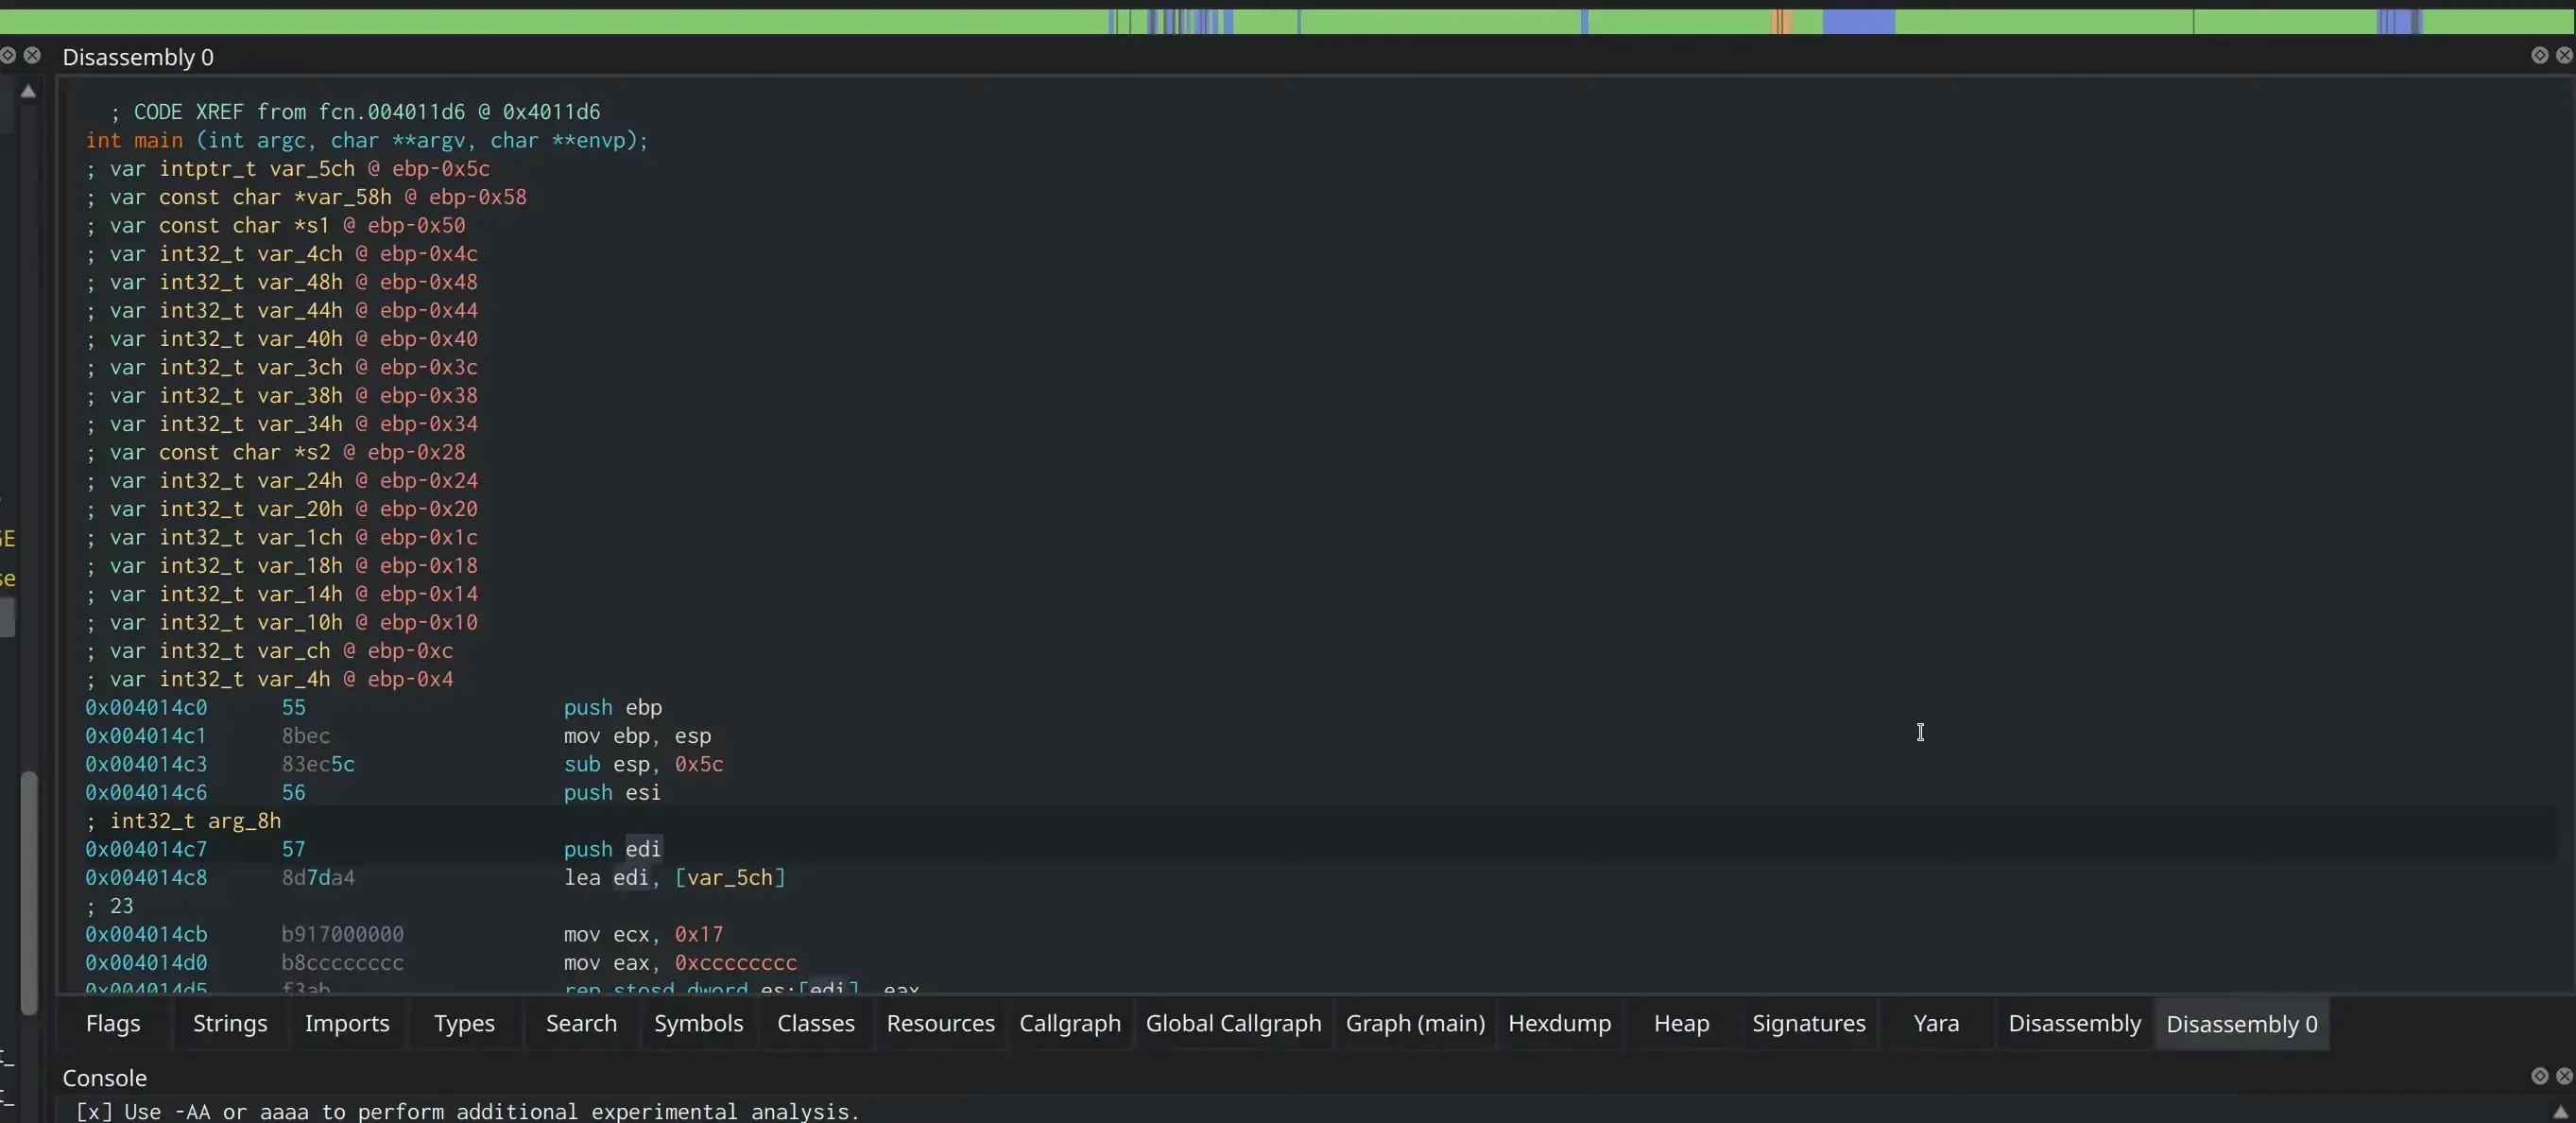 Moving the disassembly tab into a window of its own
Disassembly View
The disassembler window shows you the disassembly of the current function you are reviewing. It also allows you to “desync” the current window from other disassembly windows you have open. This allows you to view multiple functions at once without changing the view of the other windows that are open.
To do this, first, follow the instructions to add a new window in the New Tabs section of this article.
Once there are two disassembly windows, you might notice that they are both “synced” which means that when you click on one window, it changes the view of the other and vice versa. To desync these windows, you can right-click in one of them and select the sync/unsync offset option.
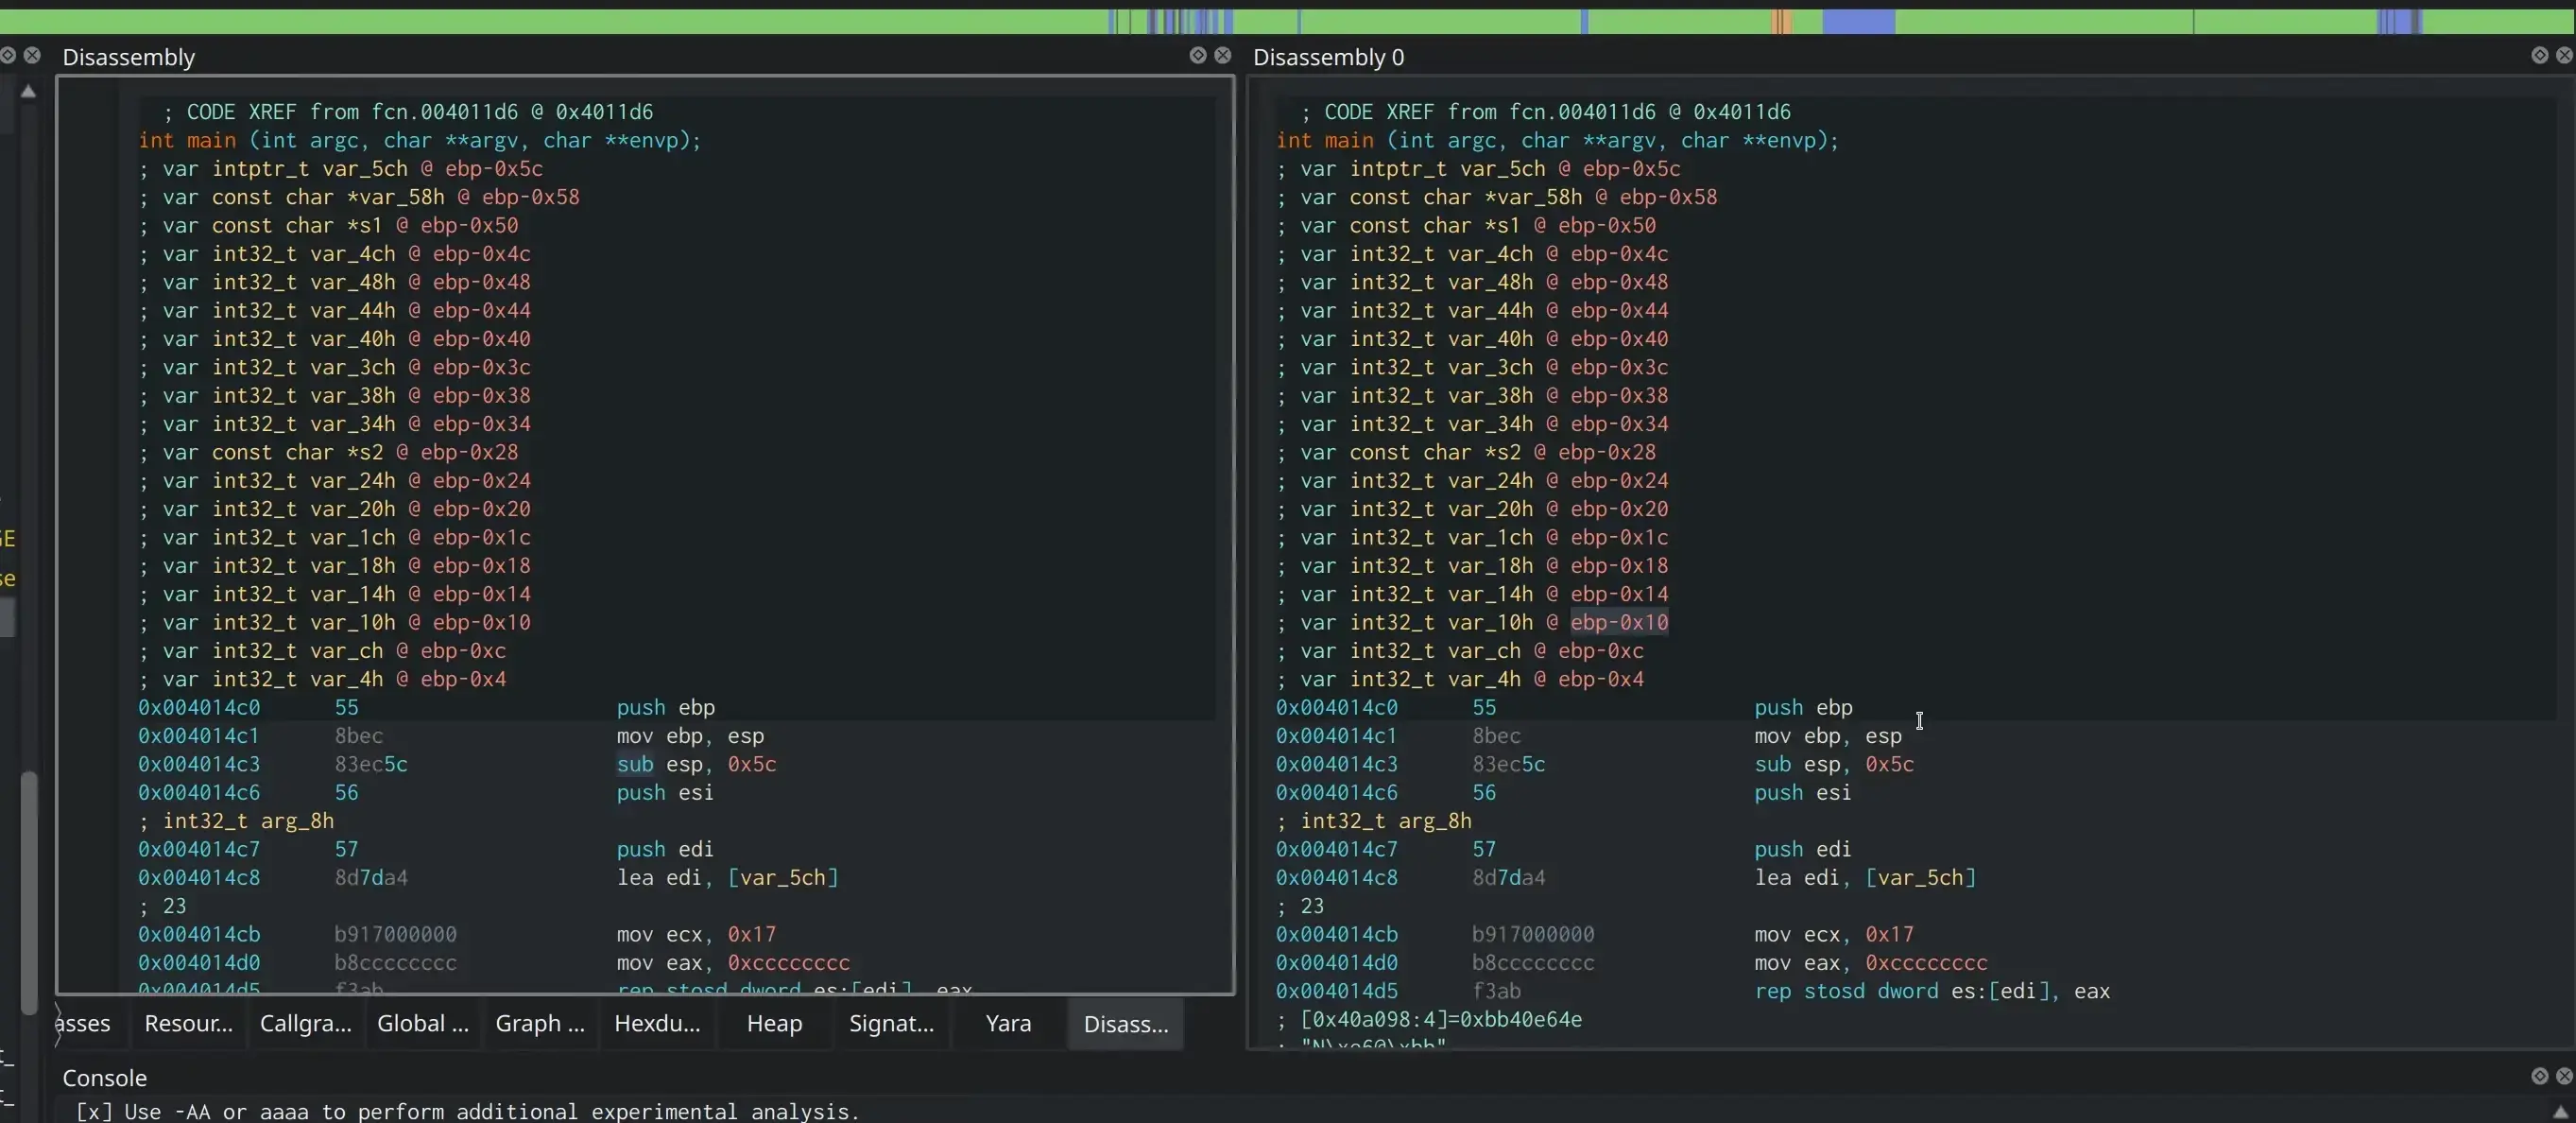 The process to desync the disassembly window
Now it is possible to open different functions in our new disassembly window without affecting the original function view. This is extremely useful when analyzing a binary with multiple function calls.
Other features in the disassembly view include: the ability to change function names, variable names, and get references to certain addresses. This is all accessed by right-clicking on the assembly instruction or variable you want information about.
For example, you can change the name of a variable by right-clicking it and selecting Rename local.... Cutter will display a menu that allows you to rename the variable. You can also change the type information about the variable to better fit the actual code.
 Changing variable names
Graph View
Like most disassemblers, Cutter offers a graph view of the current function. This allows an analyst to see branches that occur in a function from if statements and allows easier navigation than the standard disassembly view. You can add a graph view by going to Windows and clicking on Add Graph.
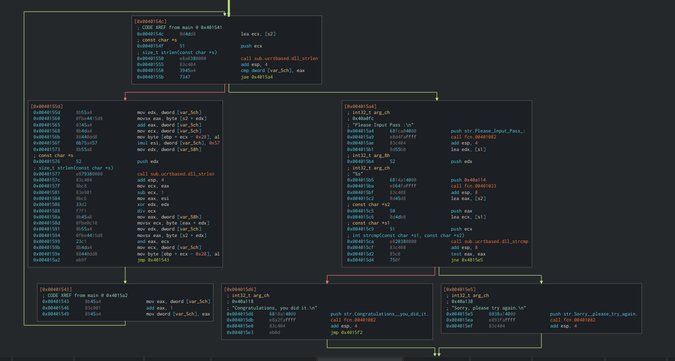 Cutter’s Graph view showing multiple branches in a function
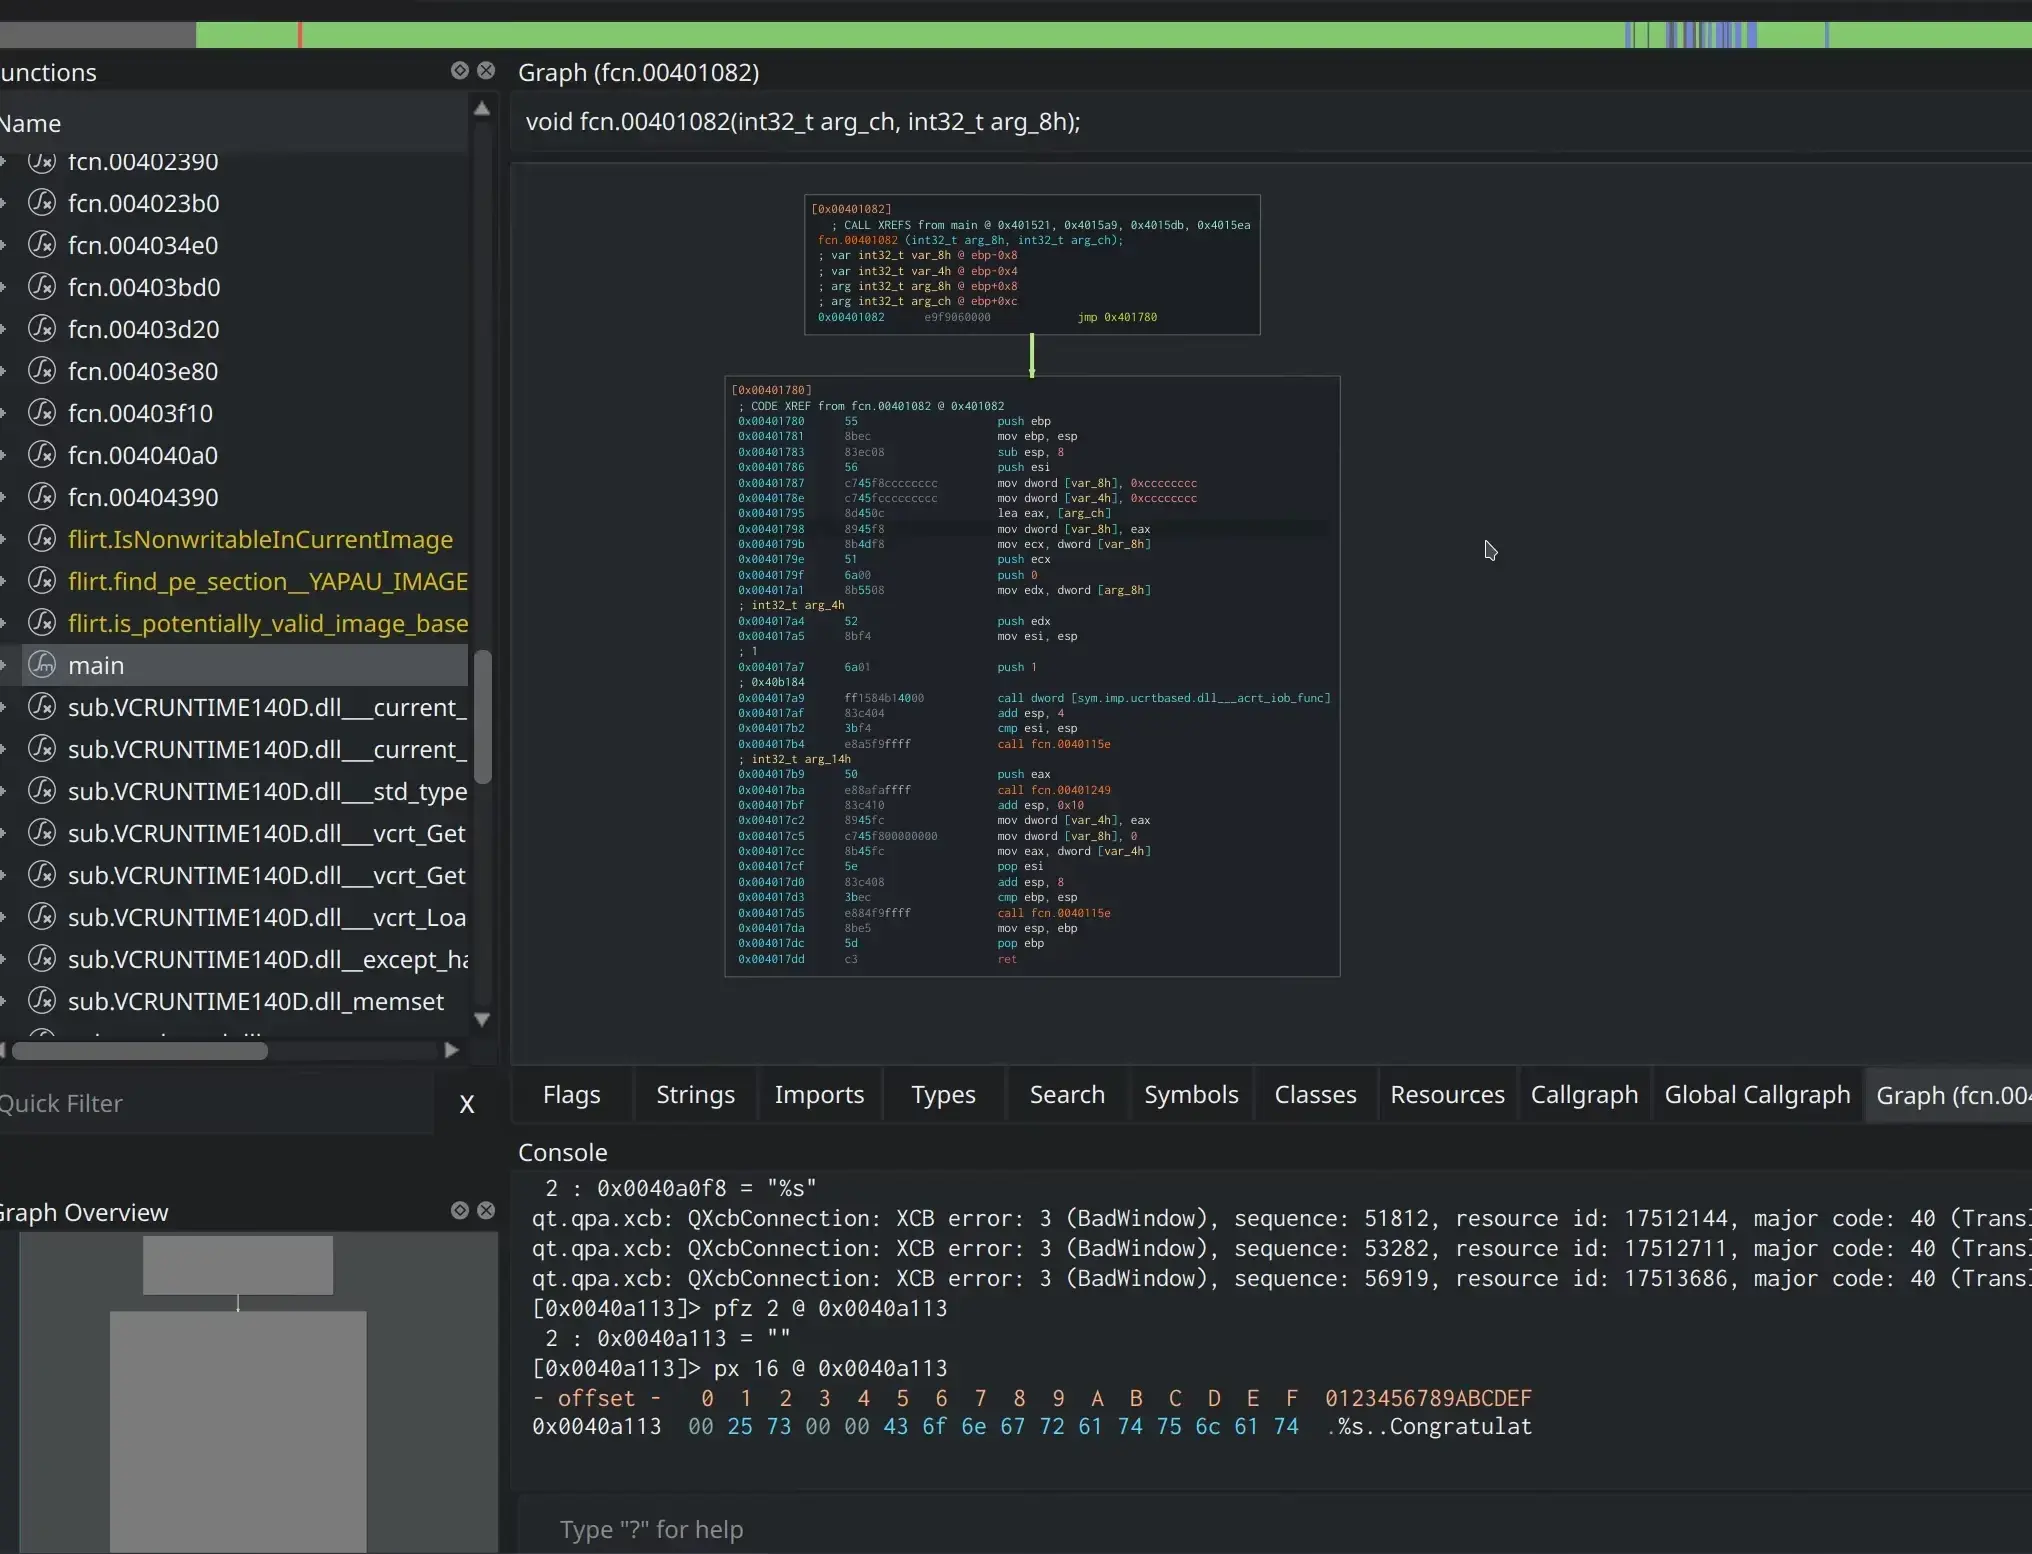
Another useful feature is the graph overview which gives a high-level view of the entire function graph. This view allows for easy navigation and the added benefit of seeing where the cursor is located compared to the whole function. To add a graph overview, click on the Windows tab and then click Graph Overview. You can drag and drop this widget anywhere on the window. I like to place it under the functions list.
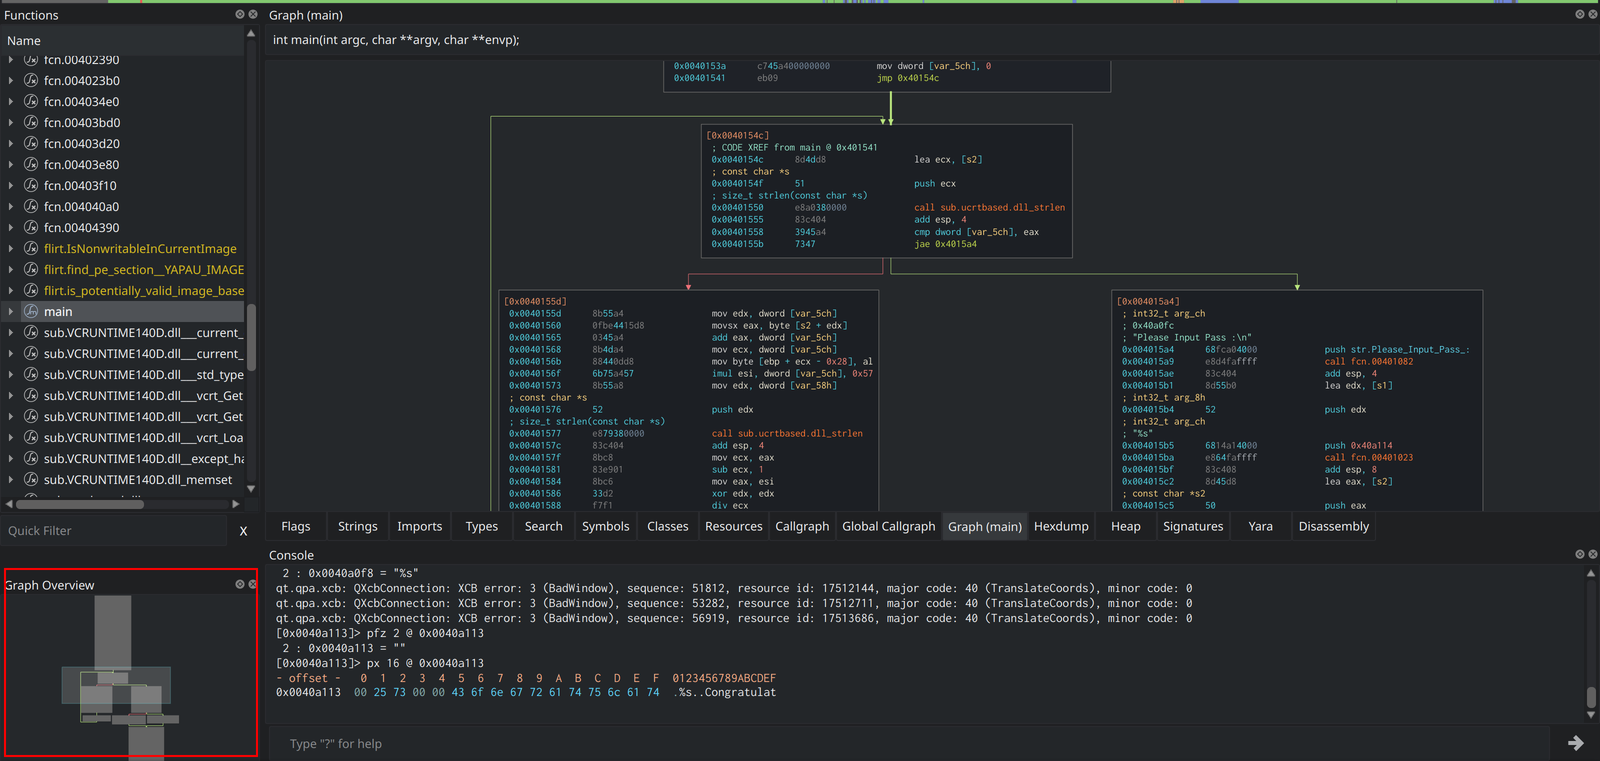 Graph Overview added to the lower-left corner of the window
Another useful feature of the graph view is the ability to highlight blocks. This will change the background color of the basic block so it is easier to find. Doing this will also show up in the graph overview which makes navigation that much easier!
To highlight, right-click on the desired box and click Highlight block. Cutter will display a color wheel allowing you to choose a desired color for the block.
 Changing block color using block highlighting
Functions
The functions widget contains a list of functions that are in the binary and allows the user to navigate to a particular function by double-clicking on it. The widget also has a search bar to help the user quickly find a function.
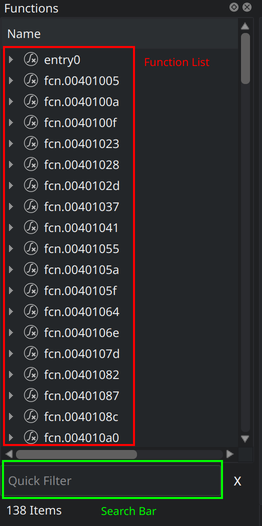 Functions widget
The functions widget can display basic information about a function in a drop-down format. It also lists information about the function including: the offset, the size in bytes, whether or not it is an imported function, the number of arguments, blocks, and local variables, the calling convention, the number of edges in the graph, the size of the stack frame, and any comments the user added.
By right-clicking the function in the menu, a user can add comments, find references to the function, and open it in a different view.
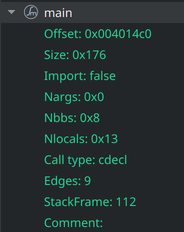 Information Cutter shows about the
 main function of the binary
Decompiler
By default, Cutter comes with two decompilers: jsdec and Ghidra. The jsdec decompiler is more low-level than Ghidra, providing a simpler version of disassembly rather than a C representation of the code.
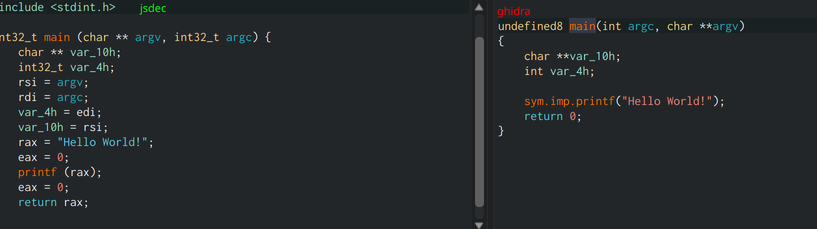 Decompiler output showing the difference between jsdec (left) and Ghidra (right)
As you can see, the Ghidra output is closer to the actual C representation of the code than the jsdec output.
To add a decompiler view, navigate to the Windows tab and click Add Decompiler. It similar features to the disassembly window including the ability to sync/unsync the window so you can view multiple functions at once.
Hexdump
The Hexdump view is interesting as it provides the flexibility of viewing the binary at a byte-by-byte level. This allows the user to viw different hash values for a set of bytes, parse a set of bytes as disassembly, and export them into various languages like Python.
The panel on the right side of the window provides this functionality. Hash values for the selected set of bytes are displayed under the Information tab. The hashes displayed are MD5, SHA1, SHA256, and CRC32. This tab will also show the entropy for the data selected.
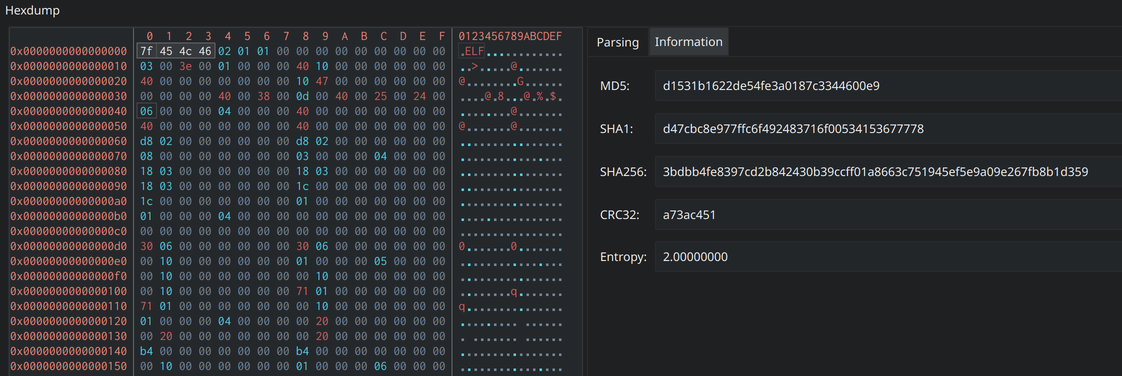 Hexdump information section showing hash values for the first four bytes of the binary
The Parsing tab allows the user to display the selected bytes in different formats. For example, if you needed the bytes to be formatted as a python bytearray this tool can do that by selecting Python in the drop-down menu.
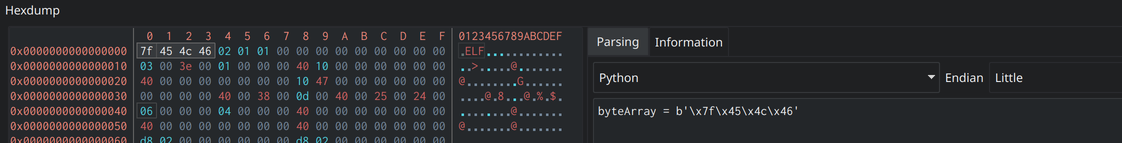 Hexdump parsing section converting the first four bytes of binary as Python bytearray
The other data formats that can be selected are:
- Converting the bytes to assembly instructions
- String
- Assembly array
- C byte array
- C words (half and double)
- Python bytearray
- JSON
- JavaScript bytearray
- Yara rule
Search Functionality
The search functionality in Cutter allows the user to search for anything in the binary from strings to Return Object Programming (ROP) Gadgets. Cutter’s search function is an extremely powerful tool for reverse engineering.
I use this tool for interesting strings, references to specific memory addresses, and assembly instructions that could indicate interesting functions such as encryption.
To add a new search window, open the Windows tab, then click Search.
To search using the tool, select the type of object you want to search for (string, assembly instruction, etc.) from the Search for box, then select the area to search from (currently mapped section, all sections, current block, raw binary, etc.). Then input what you are searching for and hit Enter.
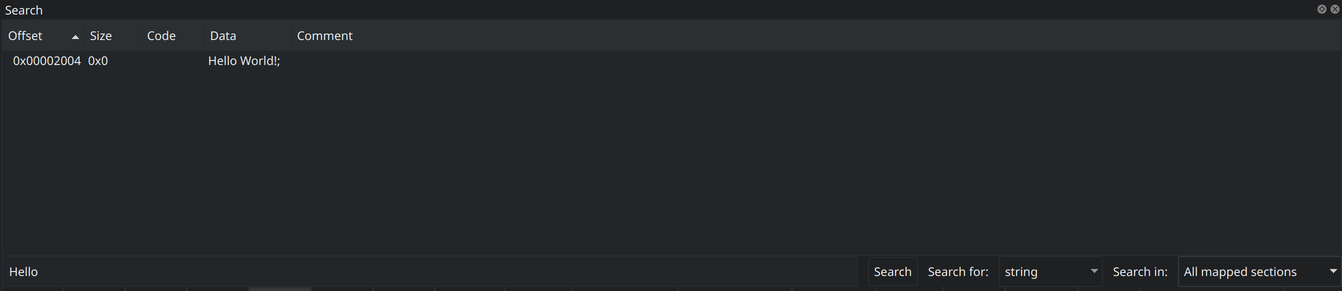 Searching for string
 Hello in binary using string search
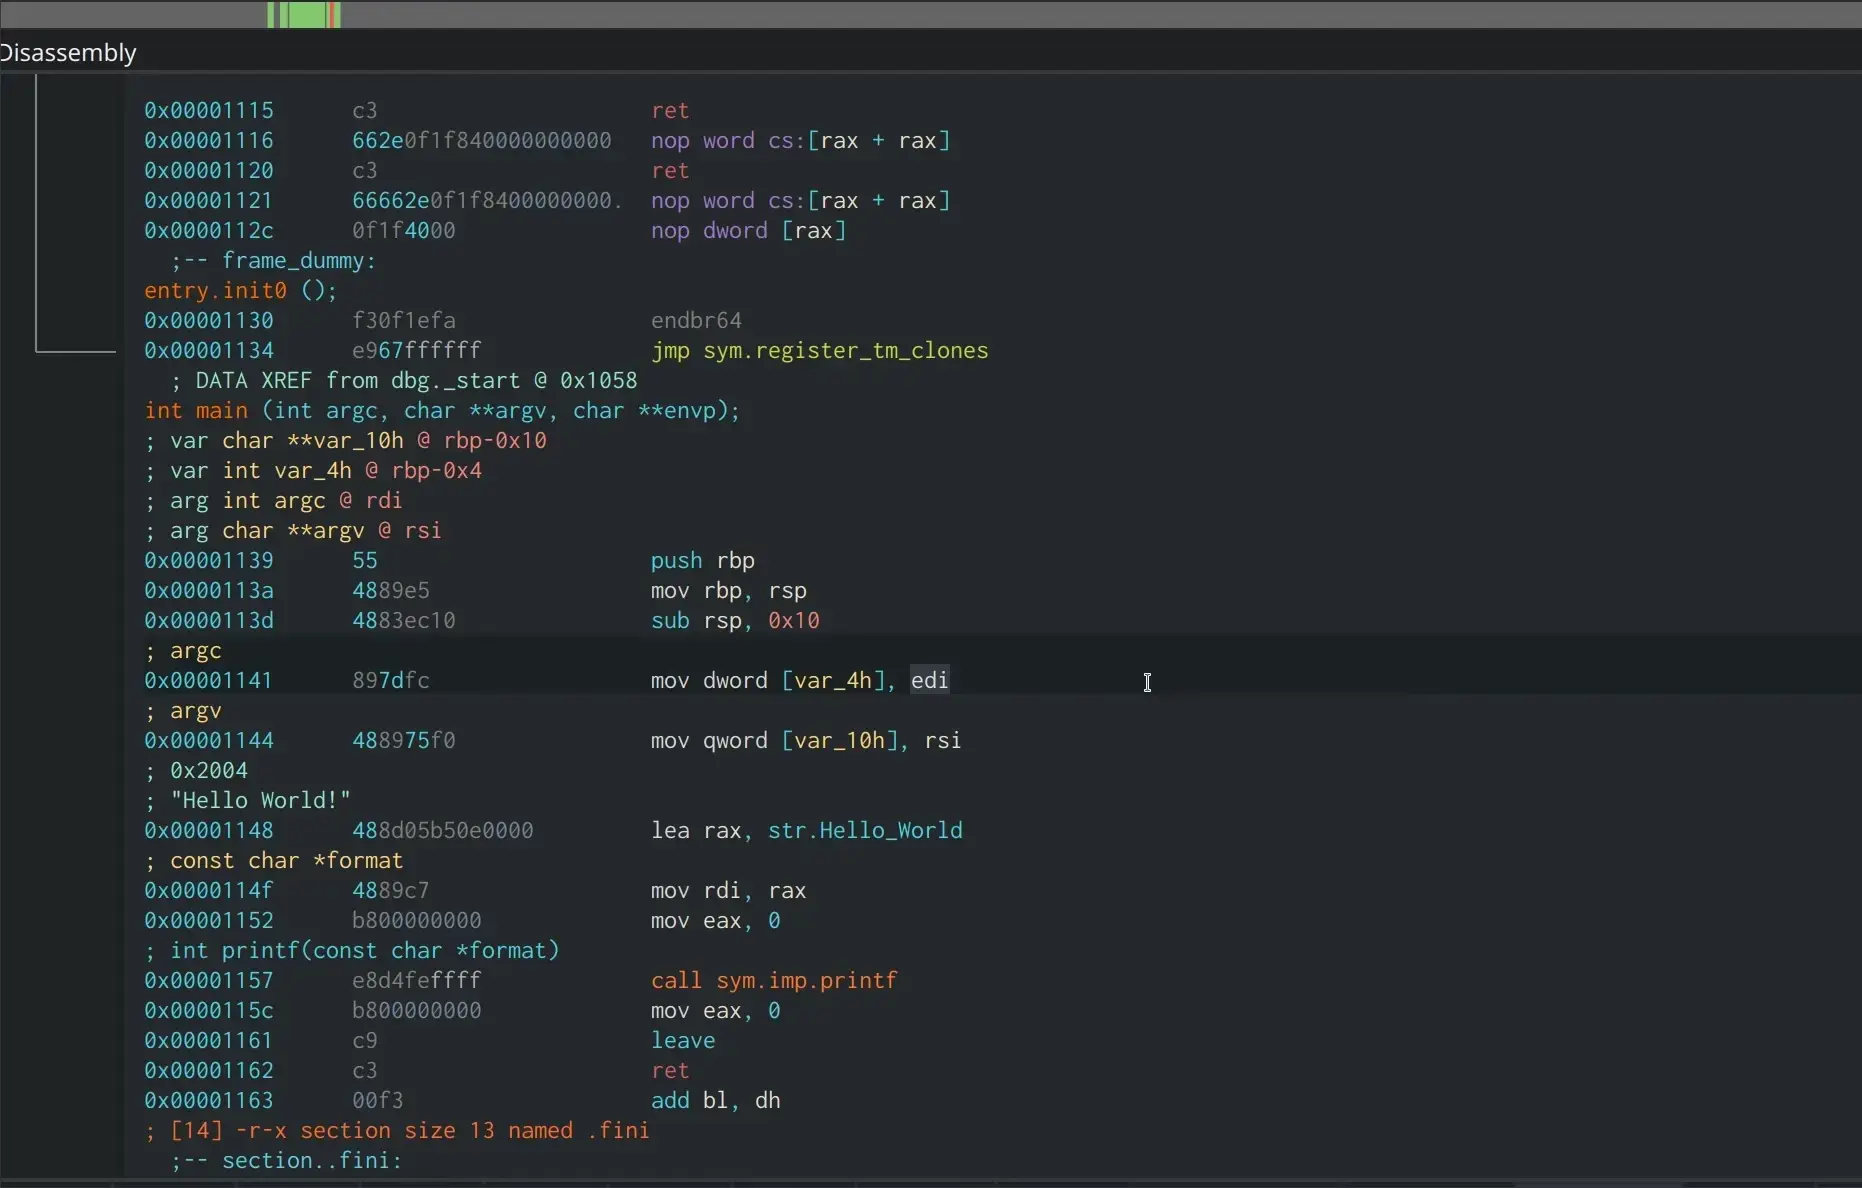
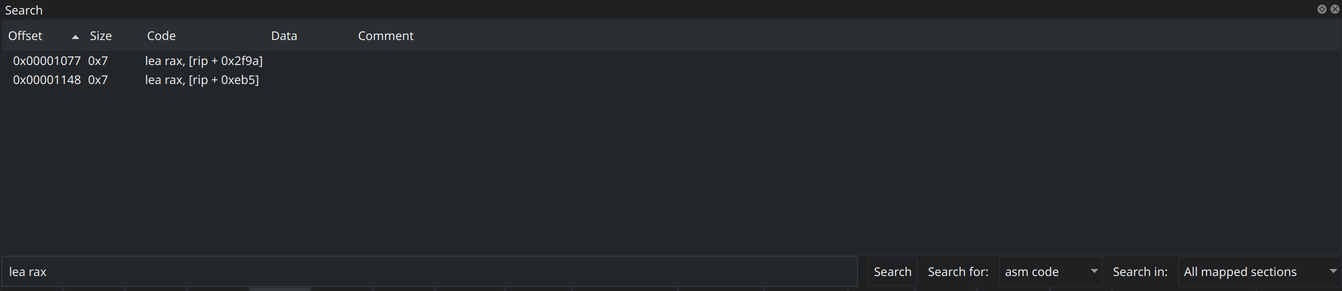 Searching for assembly code
 lea rax in binary using code search
Console
The console is my favorite utility in Cutter. It allows for the use of Rizin commands from the GUI interface, creating the best of both worlds! By default, the console is not displayed. It can be accessed under Windows and then click on Console.
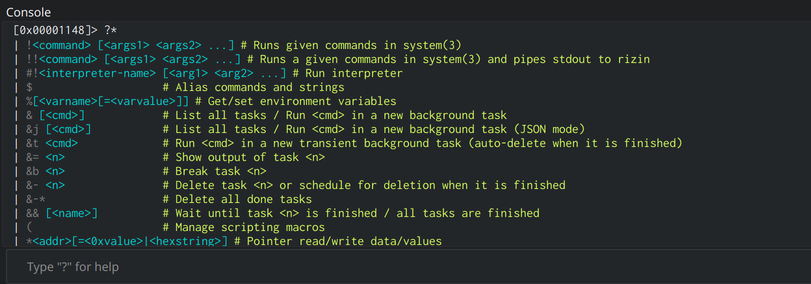 Cutter Console with example command. Fun Tip: You can list all commands in Rizin with
 ?*
Any Rizin feature that is not available in the Cutter interface can be accessed via this console. For example, you can edit all configuration variables in Rizin using the e command, but there doesn’t seem to be a way to do this in the GUI itself. If you need to change a specific setting, it would be easier to do this from the console.
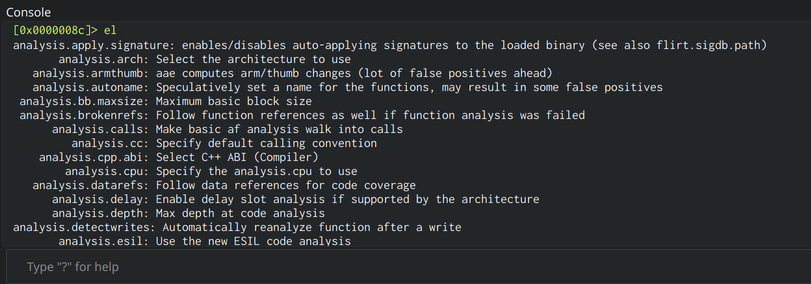 Listing all configuration variables in Cutter/Rizin using the
 el command
Conclusion
Overall, Cutter is a powerful tool when it comes to reverse engineering. I prefer it over the normal CLI as it gives the best of both worlds with the console tool. There are still other features that were not covered by this article including the new Yara functionality. There are also a plethora of plugins to explore that will aid in analysis. You can find the full documentation on Cutter’s website.
Thanks for reading and happy reversing!